How to Turn Building Data into Savings using a Successful Data Visualisation Strategy for Your Smart Building
As buildings become increasingly intelligent and connected, the amount of data generated by building systems, sensors, and devices is growing exponentially. However, without a data visualisation strategy in place, this data can be overwhelming and difficult to interpret, making it difficult to identify patterns and insights that can inform decision-making and improve building performance.
Here are some tips on how to implement a successful data visualisation strategy for your smart building using SmartViz.
1. Define your goals and KPIs
Before you start visualising your building data, it’s important to define your goals and key performance indicators (KPIs). What are the specific areas of building performance that you want to monitor and improve? What metrics will you use to measure success? By answering these questions, you can create a clear roadmap for your data visualisation strategy.
2. Collect and integrate data from multiple sources
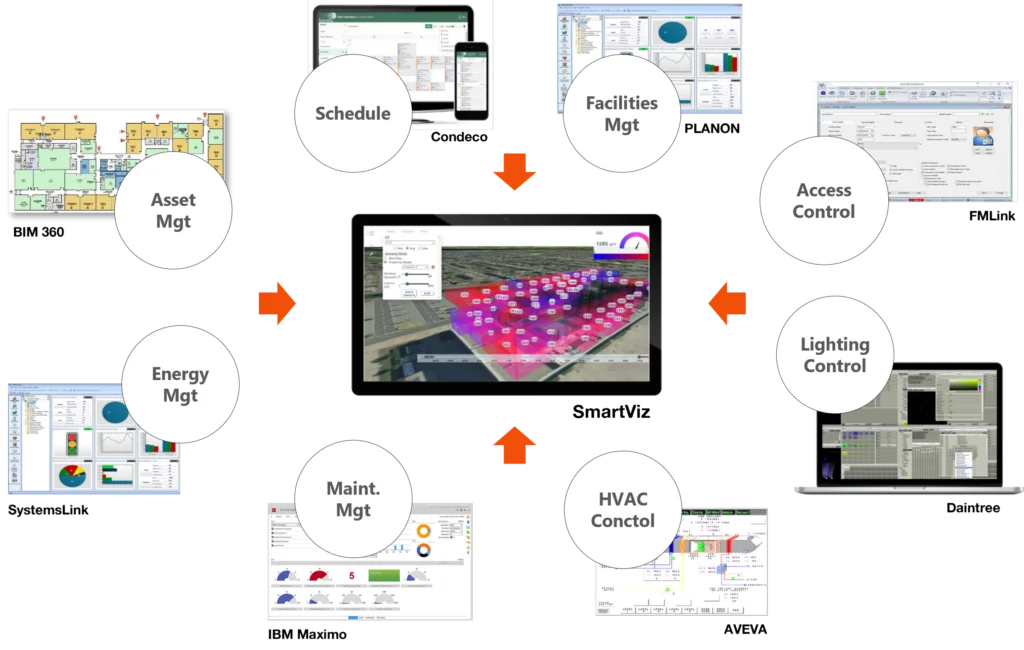
SmartViz can integrate data from a wide range of sources, including building management systems, IoT sensors, energy meters, and weather data. By collecting and integrating data from multiple sources, you can get a comprehensive view of your building’s performance and identify areas for improvement.
3. Create a single source of truth
To ensure that all stakeholders are working from the same data, it’s important to create a single source of truth. SmartViz can integrate data from multiple sources and present it in a unified dashboard, providing a clear and consistent view of building performance.
4. Visualise building data in real-time
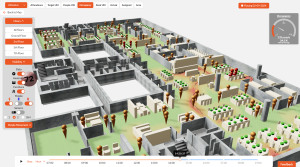
Real-time data visualisation can help you identify issues and opportunities as they arise, allowing you to respond quickly and effectively. SmartViz can visualise building data as a 3D digital twin in real-time, providing instant feedback on building performance.
5. Use predictive modeling and what-if scenarios
Predictive modeling and what-if scenarios can help you test different strategies and identify the best course of action. SmartViz can help you create predictive models and run what-if scenarios, allowing you to explore different options and make informed decisions.
6. Monitor and measure performance
To ensure that your data visualization strategy is delivering results, it’s important to monitor and measure performance against your KPIs. SmartViz can help you track performance over time and identify trends and patterns that can inform ongoing optimization.
SmartViz is a powerful data visualization platform that can help you make sense of your building data and turn it into actionable insights.
SmartViz has helped organizations across a wide range of industries improve building performance and reduce costs. Here are a few case studies:
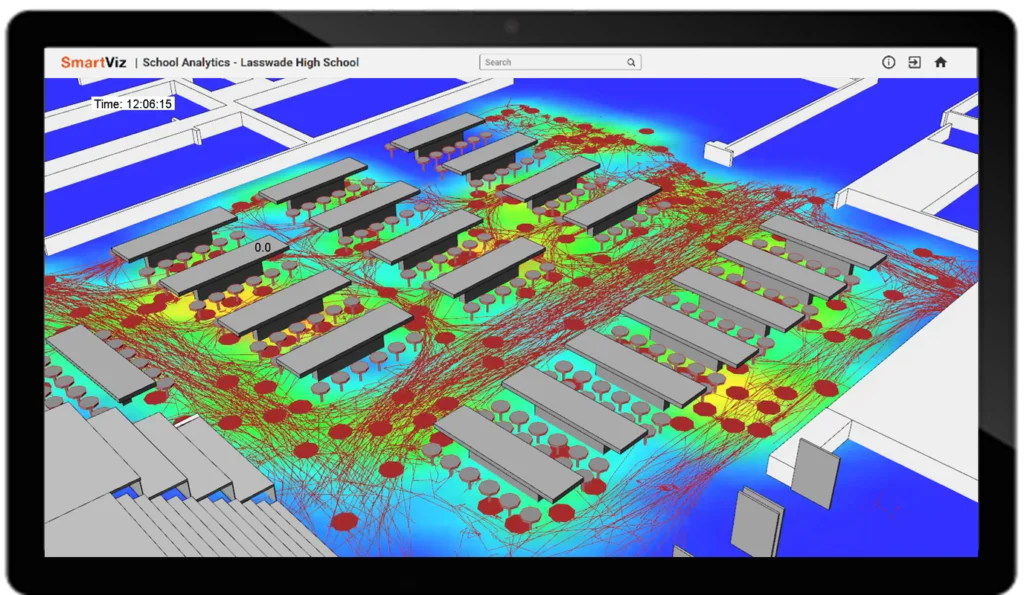
University of Southampton: SmartViz helped the university optimize space utilization, improve the learning environment for students, and save costs.
Royal United Hospital: SmartViz was used to optimize outpatient departments in terms of space utilization and efficiency.
Nationwide Building Society: SmartViz helped the building society reduce energy consumption and carbon emissions by visualizing data from a wide range of sources.
SmartViz in action
By implementing a successful data visualization strategy using SmartViz, you can improve building performance, reduce costs, and create a more sustainable and efficient built environment.
See SmartViz in action
Ready to boost the performance of your building?
Request a demo today and see how SmartViz can benefit you.